Don’t get fooled by a low P/E ratio. Learn how to evaluate this popular metric the right way—and spot true value before the market catches on.
The Most Misunderstood Number in Finance
You hear it all the time: “That stock has a low P/E, it must be cheap.” Or worse—”The P/E is high, so it’s overvalued.” But those quick takes are often wrong. A good price-to-earnings ratio isn’t a fixed number. It changes depending on the industry, growth expectations, risk profile, and even market cycles. If you’re serious about value investing, you need to know when the P/E ratio tells the truth—and when it misleads.
P/E ratios get thrown around like gospel in the investing world, but they’re often misused or misunderstood. What looks like a great deal on the surface might be a disaster underneath. And that stock with a seemingly expensive multiple? It could be compounding earnings and shareholder value in ways the raw number doesn’t reveal. Understanding this dynamic is key to avoiding traps and building a high-performing portfolio.
This article walks you through how to interpret the P/E ratio like a professional, sidestep common traps, and use this simple metric in sophisticated ways. You’ll also see how we handle P/E ratios in our Premium and Founder’s Club portfolios using refined valuation logic, adjusted earnings, and risk management frameworks.
P/E Ratio 101: What It Really Tells You (and What It Doesn’t)
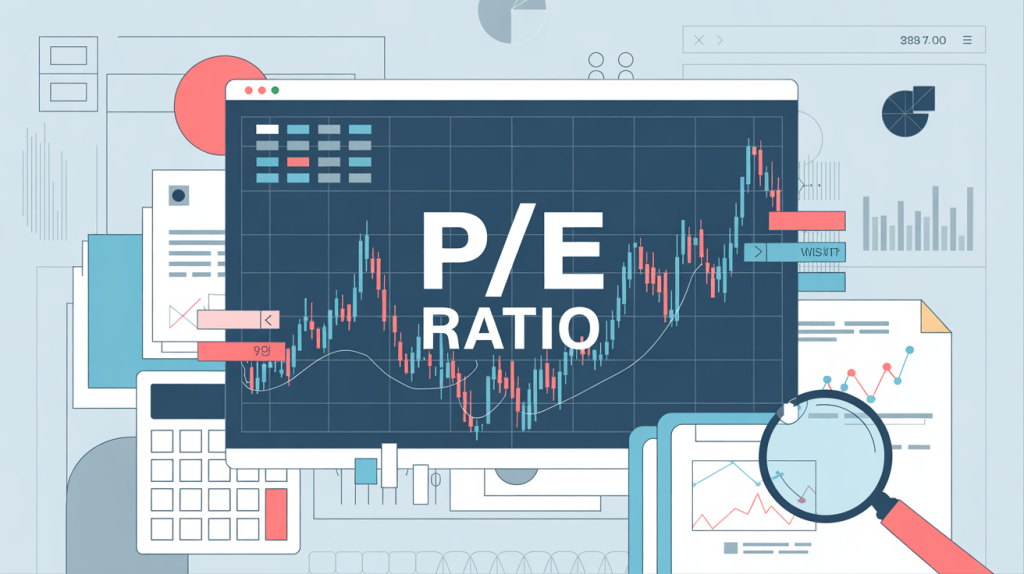
Before you can judge whether a P/E ratio is “good,” you need to understand what it measures—and more importantly, what it doesn’t. The P/E ratio compares a company’s current share price to its earnings per share. On paper, it tells you how much investors are willing to pay for $1 of earnings. But it says nothing about growth prospects, debt levels, or whether those earnings are sustainable.
A company with a P/E of 8 might be an undervalued gem—or a business in decline, with earnings about to vanish. Conversely, a P/E of 30 might be completely reasonable if the company has high margins, consistent reinvestment opportunities, and durable growth. Context matters.
The Danger of Using P/E in Isolation
Many investors get burned chasing low-P/E stocks. Sometimes those stocks are cheap for a reason—declining industries, unsustainable earnings, or ineffective management. A low P/E alone doesn’t make a stock a bargain. In fact, it can be a red flag.
Instead, use the P/E as a starting point. Then assess the quality of earnings, the health of the balance sheet, industry trends, and the company’s competitive moat. Dig into whether earnings are recurring or boosted by one-time events. We cover these deeper checks routinely in our Premium Portfolio selections—and more than a few stocks that looked cheap on P/E alone failed these tests.
To avoid being fooled, ask: Are earnings being inflated by aggressive accounting? Is the business model eroding? Are competitors gaining ground? In our experience, these qualitative factors often override the numerical appeal of a low P/E.
When a High P/E Can Actually Be a Good Thing
A high P/E isn’t always a warning sign. For companies with durable moats, strong pricing power, and rapid growth, the market will assign a premium multiple. If that company continues compounding earnings at a high rate, today’s expensive stock can become tomorrow’s value play.
We’ve held names in the Dividend Fortress Portfolio that had high P/E ratios—but the real question was relative value, not absolute. Ask yourself: is the earnings power expanding faster than the P/E multiple implies? Are free cash flow and returns on capital rising steadily?
When these conditions are met, a P/E of 30 can be a bargain—especially if other investors are too focused on surface-level valuation and missing the compounding engine under the hood.
So What Is a Good P/E Ratio? Context Is Everything
There’s no universal number. But here are some broad guideposts:
- Single-digit P/E: Possible deep value, but likely high risk or low growth
- 10–15 P/E: Could signal undervaluation in mature or cyclical industries
- 15–25 P/E: Market average—reasonable for stable, growing firms
- 25+ P/E: High-growth firms or premium franchises with pricing power
Even these are just rough categories. The key is to normalize the P/E ratio against the company’s historical range, its peers, and forward earnings expectations. At Astute Investor’s Calculus, we often compare current P/E against five-year averages and discounted cash flow estimates. A “good” P/E for one stock might be a terrible deal for another.
Also watch for companies transitioning between growth phases. A business moving from rapid expansion to maturity may see its P/E compress—not due to weakness, but because the valuation is catching up with reality.
💳 Bold Design. Slim Profile. Everyday Function.
Colorblock Slim Money Clip Bifold Wallet
A modern classic with a vibrant edge. This handcrafted wallet pairs rich Italian leathers in a striking colorblock design and features a sleek brass clip that keeps your cash secure without the bulk.
- Full-grain vegetable-tanned leather from Tuscany – ages beautifully over time
- Four card pockets hold up to 12 cards; smooth brass money clip secures bills
- Saddle stitched by hand, with polished edges and a slim silhouette
Where minimalist meets standout craftsmanship.
👉 Shop the Colorblock Wallet – $85
Earnings Cyclicality: The P/E Ratio’s Achilles Heel
In cyclical industries—like semiconductors, autos, or commodities—the P/E ratio can become wildly misleading. Earnings often peak at the top of a cycle and fall at the bottom, creating bizarrely low P/E ratios at exactly the wrong time to buy.
Sophisticated investors normalize earnings across the cycle. We use this principle to identify where the real margin of safety exists. A steel company with a P/E of 3 may still be overvalued if it’s mid-cycle and profits are about to collapse. Likewise, a shipping company posting record numbers during a supply shock may trade at a low P/E right before a multi-year decline.
We often use multi-year averages and trailing normalized earnings to adjust for these patterns and focus on sustainable earning power.
Why We Prefer Adjusted P/E and Owner Earnings
We often replace simple EPS with a cleaner measure of owner earnings that strips out accounting noise. Owner earnings focus on the actual cash available to shareholders after necessary reinvestments. This gives a more accurate picture of the company’s capacity to return capital or reinvest for growth.
For companies with significant non-cash charges, asset impairments, or investment gains, the raw P/E number can distort reality. That’s why we apply adjustments that align with the real economics of the business. Sometimes, we ignore GAAP-based P/E altogether and use custom valuation models built from first principles.
This approach helps us uncover hidden value and avoid traps invisible to investors relying on off-the-shelf screeners.
Alternatives to P/E: When It’s Time to Move On
In some cases, P/E just doesn’t cut it. Companies with no earnings, one-time distortions, or inconsistent accounting need different tools. Consider:
- Price-to-book for asset-heavy firms
- EV/EBITDA for leveraged companies or those with varying capital structures
- PEG ratio (P/E to growth) for high-growth stocks
- Net-net working capital for distressed value plays
For deep value ideas, we often rely on asset-based valuation instead of earnings-based multiples. When a company trades below liquidation value or net cash, P/E becomes irrelevant.
How We Use P/E Ratios in Our Portfolios
Across our strategies, we apply the P/E ratio differently:
- Premium Portfolio: We compare current P/E to normalized earnings and historical ranges. We blend this with metrics like EV/EBIT and adjusted book value.
- Dividend Fortress Portfolio: We emphasize earnings durability, payout ratios, dividend growth consistency, and whether free cash flow supports the dividend comfortably. A high P/E may still make sense here if the dividend trajectory is strong and supported by fundamentals.
By adjusting our lens depending on strategy, we avoid rigid rules and uncover opportunities others miss. This flexibility gives us an edge over investors who rely on static screeners.
Conclusion: The P/E Ratio Is a Tool, Not a Truth
Don’t fall into the trap of chasing the lowest number on your screen. A good price-to-earnings ratio is one that makes sense in context—one that gives you more upside than downside. Used correctly, it’s a powerful guidepost. Used carelessly, it’s a trap.
Smart investors treat the P/E as one tool in a broader valuation process. They look past the headline number and ask better questions: What’s driving the earnings? Are they sustainable? What’s already priced in? That’s where the edge lies.
Let other investors rely on shortcuts. You know better. You know that it’s the combination of valuation, business quality, capital allocation, and risk control that builds long-term wealth.
📊 Selective. Strategic. Never Overpriced.
“Value Investor: Picky, Not Cheap” T-Shirt – Premium Cotton
This shirt says what every true value investor is thinking. Clean lines, bold message — perfect for those who know the difference between low price and real value.
- Statement-making print that speaks to your investing philosophy
- Soft, breathable cotton with a flattering, true-to-size fit
- Ethically printed and designed for comfort that compounds
Because smart investors don’t chase trends — they wait for the right price.

Shailesh Kumar, MBA is the founder of Astute Investor’s Calculus, where he shares high-conviction small-cap value ideas, stock reports, and investing strategies.
His work has been featured in the New York Times and profiled on Wikipedia. He previously ran Value Stock Guide, one of the earliest value investing platforms online.
Subscribe to the Inner Circle to access premium stock reports and strategy insights.
Featured in:


