P/E Ratio Explained: When It Matters and When It Misleads
Everyone knows the P/E ratio. It’s the first number you hear on CNBC, the one retail investors quote to justify a “cheap” stock, and the headline metric on most financial screeners. But like all widely used shortcuts, it often leads people straight into mistakes. You need more than a low P/E to uncover value – you need the context behind the number. That’s what we’ll unpack today, and by the end of this article, you’ll understand exactly how to use this ratio the right way.
The P/E Ratio in Its Simplest Form: What It Actually Tells You
The P/E ratio measures how much you’re paying for each dollar of a company’s earnings. It’s calculated by dividing the current share price by the earnings per share (EPS). A lower number suggests a cheaper stock relative to earnings, and a higher number implies investors expect more future growth. But this simple definition hides a world of nuance.
That sounds useful – until you realize earnings aren’t always what they seem. In fact, they rarely are.
When the “E” in P/E Is a Mirage: Cyclical Earnings and Temporary Windfalls
Some companies look cheap only because they’re having a bumper year. Think steel mills during an infrastructure boom or oil drillers during a supply shock. Earnings spike, the P/E drops – and investors pile in. But what happens when things normalize? Reality kicks in, and that bargain can turn into a portfolio regret.
A low P/E that results from temporarily high earnings can lull you into a false sense of value. When demand returns to trend, so do margins and profits, and that “cheap” stock can suddenly look very expensive.
A few examples from recent years include:
- Auto manufacturers post-COVID, flush with demand and low inventories
- Energy companies in 2022 and 2023, benefiting from supply shocks
- Homebuilders enjoying low-rate-fueled demand spikes
In these cases, investors who relied on current P/E alone paid the price when earnings reverted. Knowing the earnings cycle and industry context could have saved them a lot of pain.
Look Beneath the Surface: Adjusting for Normalized Earnings
If earnings aren’t stable, you have to do the work of normalizing them. That means looking at average earnings over a full cycle, typically five to ten years. Remove outliers, adjust for one-time events, and think about where margins and demand are likely to settle. It takes effort, but it’s worth it.
This is how value investors identify true bargains. It’s not about buying at a low multiple – it’s about buying below intrinsic value based on normalized, sustainable earnings power. Temporary booms or busts don’t tell the whole story. A good investor reads between the lines.
Margin Expansion Isn’t Forever: When Temporary Profitability Distorts P/E
Some companies benefit from temporary factors that boost net margins: a drop in input costs, weak competitors exiting the market, or short-lived regulatory perks. Those tailwinds can make earnings look amazing, and the P/E ratio misleadingly low.
This happened in 2021 – 2022 with shipping companies. Record freight rates led to record margins, and stocks looked cheap on paper. But as rates normalized, earnings collapsed, and so did those supposedly cheap stocks.
Be wary when margins are at multi-year highs. The market is quick to reprice if those margins show signs of slipping. It doesn’t wait for an official announcement – it anticipates and punishes.
Hidden Leverage, Hidden Risk: Why Debt Skews the P/E Ratio
P/E ignores how a company is financed. Two companies with identical earnings can have vastly different risk profiles if one is loaded with debt. The risk isn’t visible in the earnings figure, but it lives on the balance sheet.
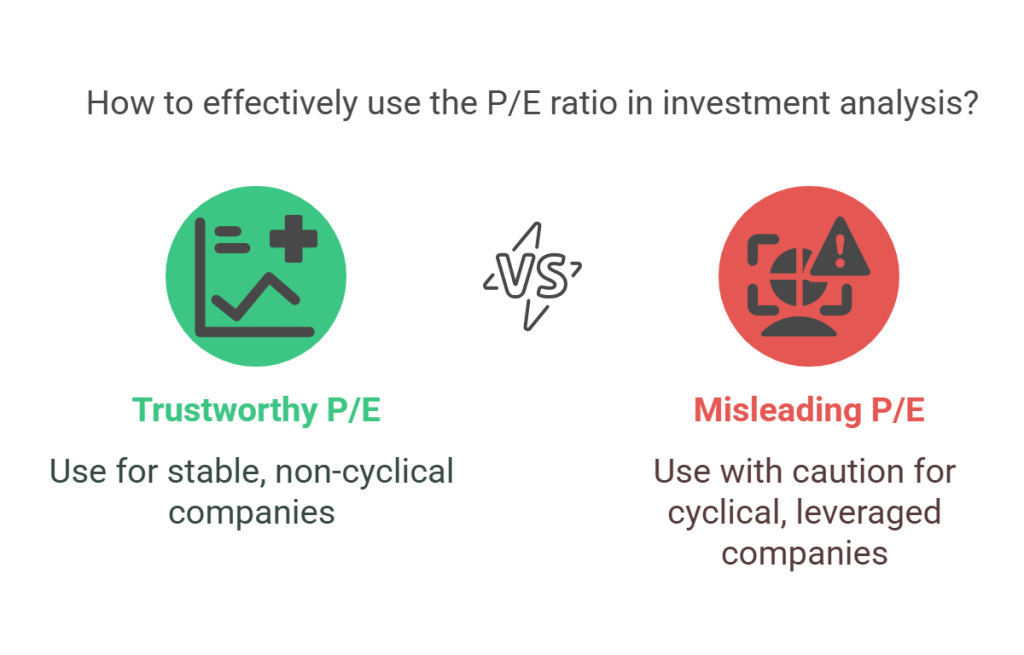
Leverage can artificially inflate earnings, especially when interest rates are low. That makes the stock look cheaper than it is. But if debt becomes unserviceable, or interest rates rise, those earnings can evaporate quickly.
In highly levered companies, metrics like EV/EBIT or EV/EBITDA offer a clearer picture of operational value. These adjust for debt and give you a better sense of the true cost of the business. If you’re serious about valuation, use them.
When You Can Trust the P/E Ratio
There are times when the P/E ratio is genuinely useful:
- The company has stable earnings and consistent margins
- It operates in a slow-changing, non-cyclical industry
- It carries little or no debt
- Management isn’t manipulating buybacks to game EPS
Examples include:
- Mature consumer staples with steady demand
- Established healthcare firms with stable cash flows and low capital needs
In these cases, the P/E ratio gives you a reliable baseline for valuation. But it still shouldn’t be the only number you look at.
Comparing Apples to Apples: Use P/E Within the Right Peer Group
Context is everything. A tech company at 20x earnings might be cheap, while a utility at 20x could be egregiously expensive. Always compare P/E ratios within the same sector or industry, and even then, look at differences in capital intensity, competitive dynamics, and long-term earnings stability.
The same multiple can mean radically different things depending on business model and growth outlook. Without proper peer context, you’re driving blind.
Don’t Stop at the Headline: Use P/E as a Starting Point – Not a Decision Maker
The P/E ratio is best used to raise questions, not settle them. When you see a low multiple, ask:
- Are earnings sustainable or inflated?
- Is the company over-leveraged?
- What are the normalized margins and long-term returns on capital?
- What are the future growth prospects?
Only after answering these should you consider whether the stock is truly undervalued. The best investors treat P/E as an invitation to investigate – not as a verdict.
Case Study Snapshots: Cheap for a Reason vs. Mispriced Opportunity
- Deswell Industries (DSWL)
P/E of ~4.2. No long-term debt. Strong balance sheet, stable profitability. This is when the P/E works – the company trades below liquidation value, and earnings are real. - A cyclical steel stock with P/E of 3
Recent earnings reflect peak commodity prices. High debt load. A classic value trap if earnings normalize. - A SaaS company with a P/E of 80
Looks expensive, but with high recurring revenue and expanding margins, the high P/E may actually be justified if growth remains robust. - A value stock with a P/E ratio in the thousands
On the surface, this looks ridiculous. But in some rare yet compelling cases, a company may intentionally take all foreseeable write-offs, impairments, and restructuring charges in a single year to clean up the balance sheet. The result is a near-zero net income – and a sky-high P/E. However, if investors trust management’s cleanup strategy and believe the company will return to normalized profitability next year, the stock price may not fall. In these cases, a very high P/E doesn’t mean the stock is expensive – it means you need to look one year ahead. Sophisticated investors know how to read between the lines and recognize when one bad year doesn’t define the company’s future.
Conclusion: Ask Better Questions, Get Better Results
The P/E ratio is like a compass – it points in a direction but doesn’t draw the map. If you take it at face value, you’ll walk straight into traps. But used correctly, it becomes a powerful tool to filter opportunities and sharpen your analysis.
Always remember: it’s not the number that matters most – it’s the story behind it.
Ask better questions. Understand the business. Trust your own judgment. That’s the real work of investing, and it always pays off in the long run.

Shailesh Kumar, MBA is the founder of Astute Investor’s Calculus, where he shares high-conviction small-cap value ideas, stock reports, and investing strategies.
His work has been featured in the New York Times and profiled on Wikipedia. He previously ran Value Stock Guide, one of the earliest value investing platforms online.
Subscribe to the Inner Circle to access premium stock reports and strategy insights.
Featured in:


