You’ve seen the lists. “21 Ratios Every Investor Must Know.” “15 Metrics That Predict Market Outperformance.” Most of these lists are bloated with academic fluff or Wall Street distractions that won’t move the needle for long-term value investors like you.
What you need is precision. You need the seven key financial ratios that actually matter—ratios that filter out noise, reveal opportunity, and protect your capital. These aren’t abstract concepts. They’re the practical tools I use every day to assess whether a stock deserves a place in my portfolio.
If you want to avoid the traps and compound wealth over time, start here.
1. Price-to-Earnings (P/E) Ratio: Commonly Quoted, Often Misunderstood
Everyone knows it. Few use it correctly.
The P/E ratio shows how much the market is willing to pay for a dollar of a company’s earnings. But the quality of those earnings matters far more than the quantity. A P/E of 6 on shrinking earnings might be expensive. A P/E of 25 on durable, growing earnings might be a bargain.
Formula:
P/E Ratio = Share Price / Earnings Per Share (EPS)
You want to compare this against peers in the same industry—and overlay it with your own expectations for future earnings.
Use case: Only trust low P/E when earnings are stable or growing and not juiced by one-time gains or write-offs.
2. Price-to-Book (P/B) Ratio: Your Safety Net in Asset-Heavy Businesses
The P/B ratio helps you anchor your valuation to something tangible—the net assets of the business.
It’s essential for companies with significant physical assets or liquid balance sheets. But not all book value is equal. Strip out the goodwill, capitalized expenses, and other accounting fluff before you make any judgment (this is called the Tangible Book Value).
Formula:
P/B Ratio = Share Price / Book Value Per Share
(Book Value = Total Assets – Total Liabilities)
P/TB Ratio = Share Price / Tangible Book Value Per Share
(Book Value = Total Assets – Total Liabilities – Goodwill – Intangible Assets)
Use case: Look for P/B below 1 in companies with real, liquid assets—and make sure those assets are priced conservatively.
3. Return on Equity (ROE): Is Management Adding or Destroying Value?
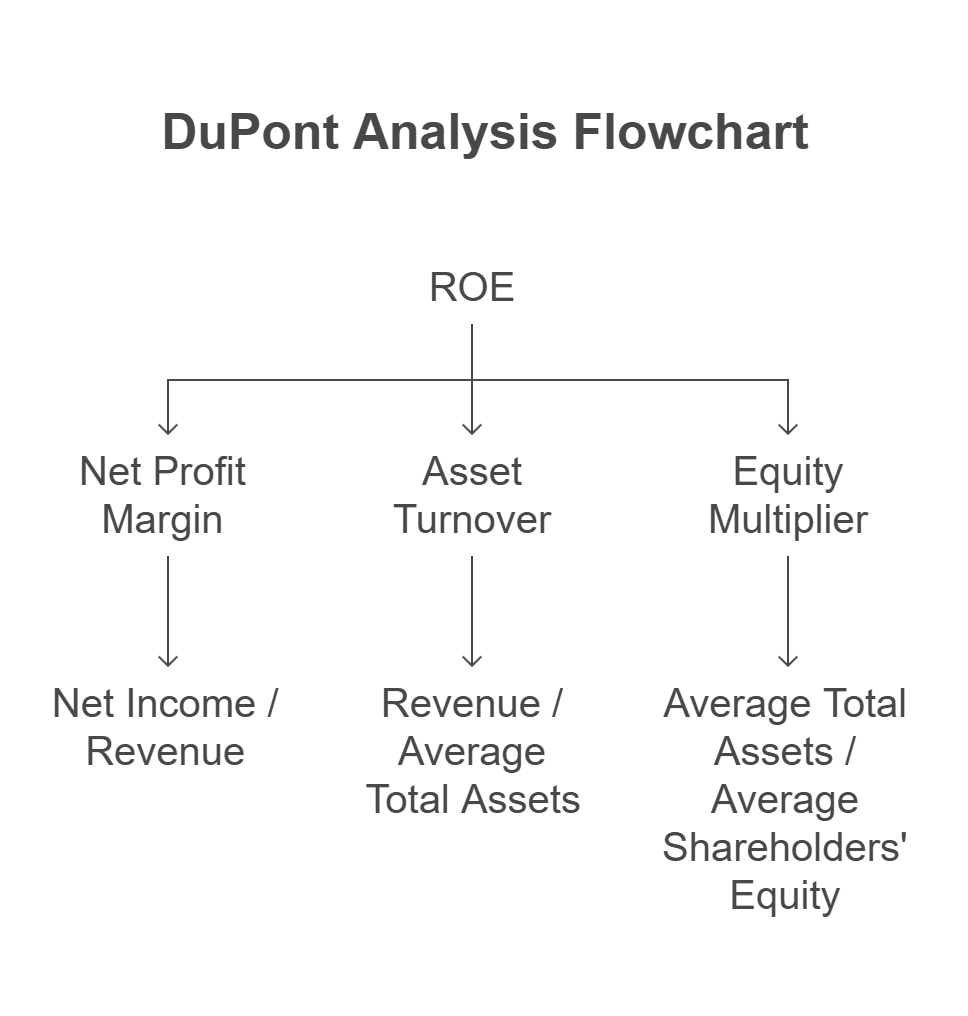
ROE tells you how efficiently a business turns shareholder equity into profits. It’s one of the best proxies for management’s capital allocation skill.
Just be cautious: high ROE can be a result of high leverage. Always compare it alongside the company’s debt profile.
Formula:
ROE = Net Income / Shareholders’ Equity
Use case: Prefer consistent ROE above 12% in capital-light businesses and above 8% in asset-heavy ones—assuming leverage isn’t hiding in the shadows.
4. Debt-to-Equity Ratio: How Fragile Is the Balance Sheet?
A high return doesn’t mean much if the business is teetering on the edge of solvency. The debt-to-equity ratio helps you understand the financial risk baked into the business.
This becomes even more important in small-cap value investing, where one bad year can wipe out thinly capitalized companies.
Formula:
Debt-to-Equity Ratio = Total Liabilities / Shareholders’ Equity
Use case: Seek companies with D/E ratios below 1 unless the business has highly stable, recurring cash flows that justify higher leverage.
5. Free Cash Flow Yield: A Clear Signal of Mispricing
Free cash flow is what’s left over after a company reinvests in itself. It’s what could be returned to shareholders—if management chose to.
Free cash flow yield tells you how much cash you’re getting for every dollar invested in the stock. Unlike earnings, it can’t be manipulated easily.
Formula:
Free Cash Flow Yield = Free Cash Flow / Market Capitalization
(Free Cash Flow = Operating Cash Flow – Capital Expenditures)
Use case: A free cash flow yield above 8% is a strong sign of undervaluation in most industries—especially if FCF is consistent.
6. Operating Margin: A Peek Into Pricing Power and Discipline
Operating margin measures profitability before interest and taxes. It reflects both pricing power and cost control.
It’s one of the best indicators of whether the business model is sustainable. Weak operating margins suggest fragility, especially in inflationary or competitive environments.
Formula:
Operating Margin = Operating Income / Revenue
Use case: Focus on trends over time. Rising margins indicate growing competitive advantages. Flat or falling margins should prompt deeper questions.
7. Earnings Yield: The Investor’s Shortcut to Expected Return
This flips the P/E ratio and reframes it in a way that matters to you as a buyer of businesses. It’s an apples-to-apples way to compare a stock against the risk-free rate.
The higher the earnings yield, the more you’re being paid to own the stock.
Formula:
Earnings Yield = Earnings Per Share (EPS) / Share Price
Use case: Compare directly with 10-year Treasury yield. If a company’s earnings yield doesn’t offer a significant premium, it’s not worth your capital.
Why the PEG Ratio Didn’t Make the Cut
The PEG ratio—P/E divided by earnings growth rate—can be useful in growth investing. But for value investors, it comes with three major flaws:
- Growth projections are unreliable. The “G” in PEG is usually based on analyst estimates, which are often wrong or overly optimistic.
- It assumes a linear relationship between value and growth. In reality, growth is often lumpy and tied to macro cycles, capital reinvestment, or industry shifts.
- It breaks down in low-growth or cyclical businesses. A stock with low growth will look artificially expensive, even if it has deep value elsewhere.
For long-term value investing, where the focus is on buying quality businesses at a discount to intrinsic value, the PEG ratio tends to mislead more than it helps. It is however a key screening criteria for Growth at Reasonable Price, or GARP, investors. We run the GARP screen regularly, but we do require the shortlisted stocks to be undervalued by other means before we can consider them for our portfolios.
Putting It All Together: From Numbers to Narrative
Each of these ratios tells a part of the story. But the real insight comes when you see how they relate to each other.
- Low P/B + High ROE → Undervalued compounder.
- High FCF Yield + Low Operating Margin → Possibly overlooked but cost-sensitive business.
- Low P/E + High Debt → Value trap warning.
Pattern recognition is everything. With practice, you’ll start spotting setups where the risk is capped, and the upside is wide open.
Ratios Are Your Compass—Not Your Map
These seven key financial ratios are not a magic formula. They’re tools. But in the right hands—your hands—they can separate the fleeting trades from the enduring investments.
Use them to ask better questions. To find your edge. To build a portfolio that works quietly in the background, compounding wealth while others chase trends.
The goal isn’t to find stocks that go up tomorrow. It’s to build a foundation that creates lasting wealth for decades.

Shailesh Kumar, MBA is the founder of Astute Investor’s Calculus, where he shares high-conviction small-cap value ideas, stock reports, and investing strategies.
His work has been featured in the New York Times and profiled on Wikipedia. He previously ran Value Stock Guide, one of the earliest value investing platforms online.
Subscribe to the Inner Circle to access premium stock reports and strategy insights.
Featured in:


