As a long term investor, you know that that some numbers are more important than others to find out which company deserves your investment dollars. Profitability Ratios tell you whether the business is running efficiently and creating value for the shareholders, or is eroding value over time investing in bad projects one after another.
Earnings reports and conference calls can paint an over optimistic picture of the business performance. These profitability ratios will show you whether the company truly sports a superior earnings power, or is it all just a show.
Why Profitability Ratios Belong at the Core of Your Analysis
Before we jump into individual ratios, let’s understand their role. Profitability ratios do more than just track earnings; they tell you how well a company converts sales into profit, how efficiently it uses capital, and how defensible its margins are. These are not surface metrics. These are internal pulse checks. And as every serious investor knows, businesses live or die by how well they manage costs and generate returns on invested capital.
As you look at these ratios in a point in time, you need to know whether these values are good, bad, or just average. For this, you need reference data. There are two sets of references you should consider
- How are these ratios compared to other companies in the same industry/sector? Is this company best of the bunch and likely to give you a durable long term investment?
- How are these ratios trending over time? Is the company becoming more profitable by scaling up, growing into new markets, adding new business lines, etc, or is it declining, and why?
With this in mind, let’s take a look at the most important profitability ratios.
Net Profit Margin: Probably the First Ratio You Should Review
Net profit margin is often the first ratio new investors look at, and for good reason. It shows how much of every dollar in revenue turns into actual profit after taxes and expenses. But it can also mask weak business models that benefit temporarily from cost cuts or non-operating gains. A high margin today means little if it’s unsustainable tomorrow. That’s why we treat it as an initial screen, not a green light.
Net Profit Margin = Net Income / Revenue
Watch for one-time items, tax changes, and cyclical boosts that inflate margins.
A review of the historical trends can tell you a great deal about the business.
Gross Margin: The Topline Profitability Ratio
If you want to understand a company’s pricing power and cost structure, gross margin is your best friend. A widening or stable gross margin in a competitive industry is often the first signal of a moat forming or expanding. It tells you whether the business is adding value at the point of sale or just fighting a commodity war.
Gross Margin = (Revenue – Cost of Goods Sold) / Revenue
Use it to compare against peers, track margin trends, and flag early signs of strategic pricing strength.
You will notice that different industries/sectors have widely different gross margins. Some tech/semiconductor businesses have gross margins as high as 75%, especially if they are fabless. More capital intensive businesses, and commodity businesses, generally have low gross margins, typically in 20% range.
Operating Margin: Do they Run an Efficient Operation?
Gross margins tell you about product economics. Operating margin zooms out and shows you the entire business machine. How well management turns sales into profits after accounting for SG&A, R&D, and other overheads? This is often where poorly run companies get exposed.
Operating Margin = Operating Income / Revenue
Look for consistency over time and how it stacks up in industry context. In case of anomalies, you may want to take a deeper look into individual overhead line items. Is SG&A growing faster than the revenue? Perhaps the managers are getting greedy and over compensating themselves! Or perhaps the company is investing more in R&D now and it will result in greater returns in the future? It is important to understand what is going on in the business.
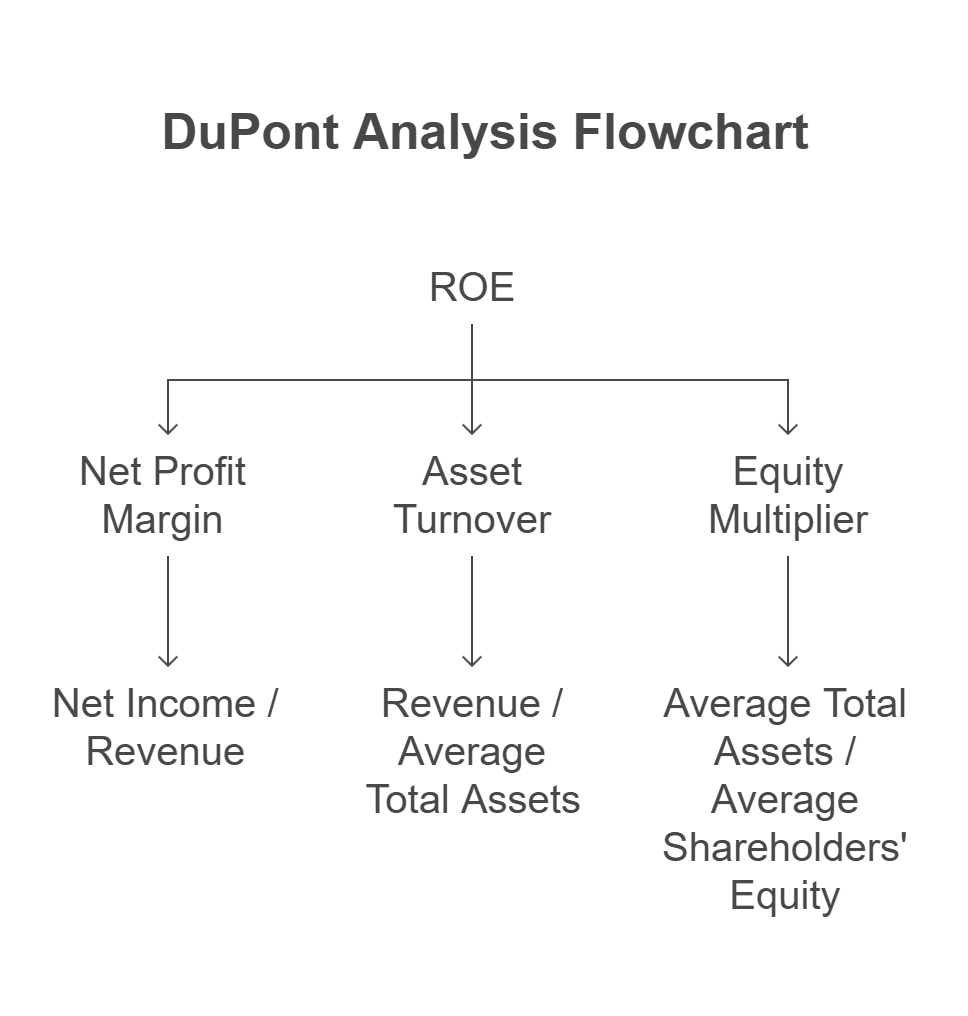
Return on Equity (ROE): High Returns Could Hide High Risk
At first glance, a high ROE looks impressive. But dig deeper. ROE can be juiced through leverage, and unless you adjust for that, you may end up chasing risky capital structures. That said, a consistently high ROE from retained earnings (not debt) is a strong signal of capital allocation skill.
Return on Equity = Net Income / Shareholder Equity
Compare with ROA and debt levels to isolate leverage effects.
Return on Assets (ROA): Measuring True Efficiency
ROA tells you how effectively a company turns its asset base into profit. Unlike ROE, this ratio isn’t distorted by financial engineering. It’s especially useful when analyzing asset-heavy industries like manufacturing, utilities, or REITs.
Return on Assets = Net Income / Total Assets
This ratio helps compare capital intensity across businesses and avoid inefficient operators. Of course, this will be less applicable in asset light businesses such as service companies or tech/pharma companies.
Return on Invested Capital (ROIC): The Gold Standard
If you only choose one ratio to master, make it ROIC. This is how you measure true wealth creation, how much profit the company generates for each dollar of capital invested, whether that capital comes from debt or equity. It’s a favorite among elite investors for good reason.
Return on Invested Capital = NOPAT / Invested Capital
Where,
NOPAT stands for Net Operating Profit After Tax.
NOPAT = EBIT x (1 – Tax rate)
Invested Capital refers to the total amount of capital, both debt and equity, that has been put into the business to generate profits. It typically includes the company’s total equity, debt, and other long-term liabilities, minus non-operating assets like excess cash or investments not used in day-to-day operations. One common formula is:
Invested Capital = Total Assets – Non-Interest-Bearing Current Liabilities – Excess Cash
Alternatively, it can be calculated as:
Invested Capital = Interest-Bearing Debt + Shareholders’ Equity – Non-Operating Assets
The goal is to isolate the capital that is actually employed in the business to generate returns
Consider this: in your personal life, you have investments after you pay your bills and the invested capital could include the cash you have accumulated from your earnings as well as any cash you borrowed (say on margin, or a loan/mortgage). It is a similar concept.
Compare ROIC to the company’s weighted average cost of capital (WACC) to judge value creation.
Profitability Trends Over Time: Spotting the Inflection Points
Don’t look at any of these ratios in isolation or at one point in time. While it does give you some information, the power lies in the trend. Rising profitability often signals improving operations, growing competitive advantages, or smart management decisions. Declining trends may be early warnings long before they show up in revenue or EPS.
When looking at the trends, consider looking back 5 or 10 years. This should cover most major industry cycles and economic conditions. It would also cover the time management would have taken to alter strategy and see results.
How I Use Profitability Ratios in My Premium Portfolio
In my own small-cap value strategy, profitability ratios play a vital role. I use them not only to screen companies but also to size positions and validate turnaround stories. For example, when I see ROIC rising quarter over quarter in a low-expectation stock, it tells me something meaningful is changing behind the scenes. That’s the kind of edge fundamental investors live for.
Don’t Just Look. Understand.
These ratios aren’t just data they are diagnostics. They don’t tell you what the company does, but they show you how well it does it. Mastering profitability ratios is about thinking like a business owner, not just a stock picker. And once you develop the habit of interpreting them in context, you’ll start seeing opportunities others miss.

Shailesh Kumar, MBA is the founder of Astute Investor’s Calculus, where he shares high-conviction small-cap value ideas, stock reports, and investing strategies.
His work has been featured in the New York Times and profiled on Wikipedia. He previously ran Value Stock Guide, one of the earliest value investing platforms online.
Subscribe to the Inner Circle to access premium stock reports and strategy insights.
Featured in:


