A Fortress Made of Paper
You spot a stock trading at 40% of book value. It’s profitable. It pays a dividend. You start to feel that familiar itch—the one that whispers undervalued gem. The numbers check out. The market seems to have missed it. But a few months later, the stock is crushed. The dividend’s gone. Earnings evaporate. You just stepped into a classic value trap.
What went wrong?
You didn’t check the debt ratios.
Before you commit a single dollar to a stock—especially in the small-cap value space—you need to understand how the company is capitalized. Because when earnings stumble, debt doesn’t quietly wait in the background. It becomes the main character. And if you’re not paying attention, it’ll be your capital that gets wiped out first.
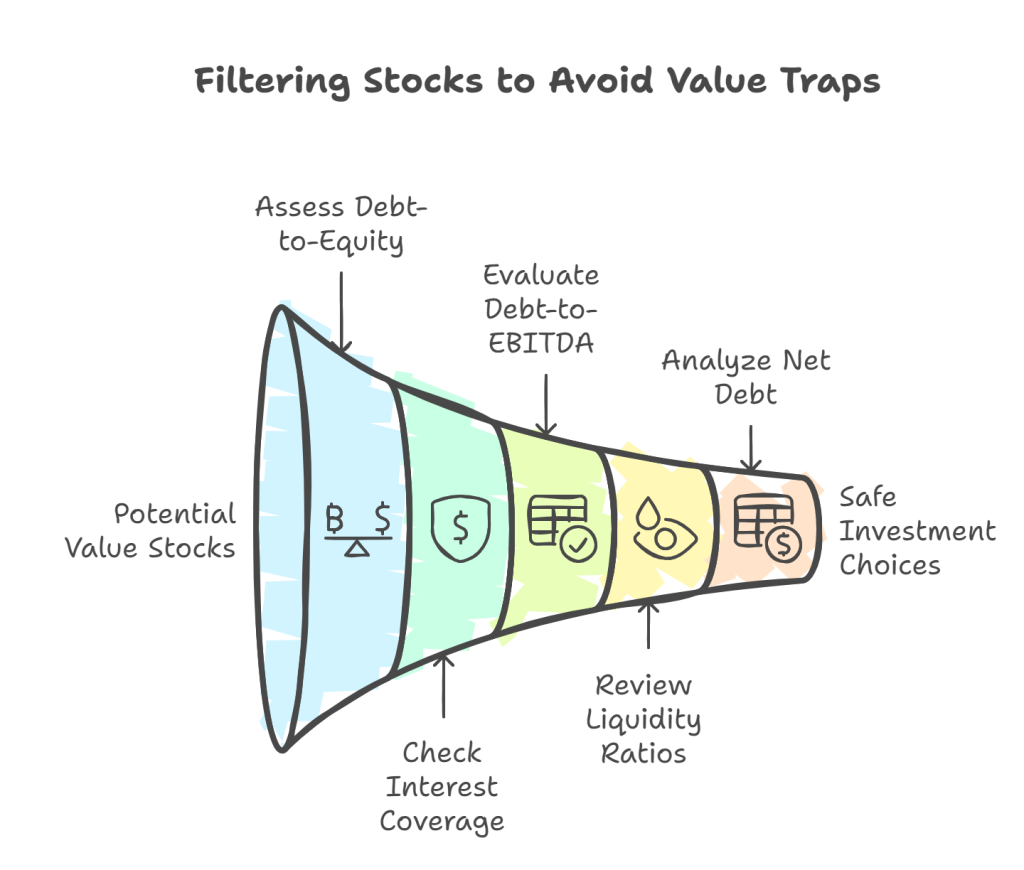
Here are the debt ratios that deserve your attention—ratios that could spare you from a catastrophic misstep.
Why Debt Ratios Are Your Lifeline in Value Investing
As a value investor, you naturally gravitate toward stocks that are out of favor. That’s where the inefficiencies hide. That’s where the bargains live. But there’s a critical distinction between discounted and distressed—and that distinction often lies on the liability side of the balance sheet.
A company can look undervalued based on price-to-book or P/E alone. But if it’s loaded with short-term debt, exposed to variable interest rates, or can’t cover its fixed obligations, it doesn’t matter how “cheap” it looks. You’re not buying a cigar butt—you’re picking up a lit fuse.
This is why you need to approach debt with the same scrutiny you bring to valuations. Because a low P/E might simply be the market pricing in bankruptcy risk.
Debt-to-Equity Ratio: Your First Line of Defense
This is the most basic lens through which to view financial leverage.
Formula:
Debt-to-Equity = Total Liabilities / Shareholders’ Equity
A high debt-to-equity ratio tells you the company is funding its growth or operations more through borrowing than retained earnings or equity. That might be fine—until the business slows down or the cost of capital spikes. Then the downside of leverage shows up quickly.
If you’re analyzing a small-cap industrial firm with a debt-to-equity ratio above 1.5, you need to ask some serious questions. Do they have recurring revenue? Are they asset-heavy with reliable cash flows? Can they roll over their debt without diluting shareholders?
In small caps without fortress balance sheets, I prefer to stay under 1.0. Sometimes far under.
Interest Coverage Ratio: Can the Company Even Breathe?
Earnings can fluctuate. Margins can compress. But interest payments are non-negotiable. That’s where the interest coverage ratio comes in.
Formula:
Interest Coverage = EBIT / Interest Expense
Let’s say a company earns $10 million in EBIT and pays $2 million in annual interest. The coverage ratio is 5. They’re breathing fine. But what if EBIT drops 40% in a tough year? Suddenly, they’re at 3. If that ratio gets below 2, you’re in thin air.
You should especially watch this ratio in capital-intensive businesses—manufacturers, telecoms, even REITs. If the ratio is below 1.5 and earnings aren’t rock solid, your so-called “value” stock might be a few quarters away from a dividend cut or equity raise.
Debt-to-EBITDA: Stripping the Business to the Core
EBITDA strips out everything that isn’t core operating performance—taxes, depreciation, and amortization. That makes this a favorite of credit analysts and bankers when assessing raw earning power.
Formula:
Debt-to-EBITDA = Total Debt / EBITDA
If a company has $90 million in total debt and $30 million in EBITDA, it’ll take three years of earnings just to pay off its debt—assuming it pays no taxes, makes no capital investments, and pays no dividend.
You should aim for ratios under 3 in most industries. Once you get past 4 or 5, the company either needs to have unusually stable cash flows—or you’re looking at a turnaround that better go exactly as planned.
If you’re buying deep value names, this ratio is your margin-of-safety backstop. Ignore it, and the “value” disappears fast when covenants get breached or refinancing becomes impossible.
Liquidity Ratios: Will They Make It to the Next Quarter?
Sometimes, the real risk isn’t insolvency in a few years—it’s not making payroll next month. That’s where the current ratio and quick ratio come into play.
Formula:
Current Ratio = Current Assets / Current Liabilities
Quick Ratio = (Current Assets − Inventory) / Current Liabilities
A current ratio below 1.0 tells you the company has more short-term liabilities than it has current assets. They might rely on revolving credit or hope for an accounts receivable miracle to make it through the quarter. And hope isn’t a strategy.
The quick ratio goes a step further—it removes inventory, which might be hard to liquidate in a hurry. For retailers, that matters. For manufacturers? Crucial.
If either of these ratios are weak and the business doesn’t have strong operating cash flow, you’re looking at a potential funding gap—maybe one that gets filled with expensive debt or equity dilution.
Net Debt: The Rawest Look at Leverage
Sometimes all you want is the truth. How much debt would be left if the company threw all its cash at it today?
Formula:
Net Debt = (Total Debt − Cash and Equivalents)
If that number is negative, good. That’s a cash-rich company with optionality. If it’s positive, how big is the number? Can they pay it down quickly? What happens if EBITDA takes a 20% hit?
Net debt is especially useful when comparing companies across sectors. A tech firm with $300 million in debt might seem overleveraged—until you notice they’re sitting on $700 million in cash. You’re looking at negative net debt.
For deep value investors, a company with low or negative net debt can be a hidden gem—because it often means you’re paying less than the cash-adjusted enterprise value of the business.
Putting It All Together: A Simple Checklist to Avoid Value Traps

Before you buy a “cheap” stock, ask yourself the following:
- Is the debt-to-equity ratio below 1.0 and stable?
- Is the interest coverage ratio comfortably above 2?
- Is the debt-to-EBITDA under 3—preferably much lower?
- Are the current and quick ratios strong enough to handle short-term shocks?
- Does the company have low or negative net debt that gives them breathing room?
One or two red flags don’t automatically disqualify a company. But if the balance sheet is loaded and the cash flow story is unconvincing, you might want to move on—even if the stock trades at 0.4x book.
That’s how you sidestep the traps.
Closing Thoughts: The Illusion of Value
A low P/E is not a moat. A high dividend is not a safety net. And a 50% discount to book value doesn’t mean much when the “book” is financed by mountains of short-term debt.
In value investing, you’re not just buying assets. You’re buying liabilities too.
So read the filings. Run the ratios. If you see debt levels that could crush the company in a bad year, walk away. You don’t need to be a hero. You just need to protect your capital so it’s ready for the next real opportunity.
And the best way to do that?
Don’t let debt sneak up on you. Make these ratios your habit—and your armor.


