ROE Alone Can Mislead You.
Return on Equity (ROE) gets a lot of attention—and rightly so. It’s a quick indicator of how effectively a company generates profits from shareholders’ capital. But used in isolation, ROE can give you a false sense of security. What you really need is a way to unpack ROE into its true drivers—a way to peek under the hood and see how value is really being created or destroyed. This is where the DuPont Analysis earns its keep. If you’ve been ignoring it, you’re operating with blinders on.
Let’s fix that.
ROE Is Just the Starting Point, Not the Destination
Before we dive into the DuPont framework, let’s clarify what ROE really measures. It’s net income divided by shareholder equity. That’s it.
But two companies can report identical ROE figures, and have entirely different business risk profiles. One might be heavily leveraged; the other might run lean and generate profit through superior margins or operational efficiency. Without context, ROE is just a number.
Here’s where the DuPont formula steps in as your decoding tool.
The DuPont Breakdown: Three Levers That Actually Matter
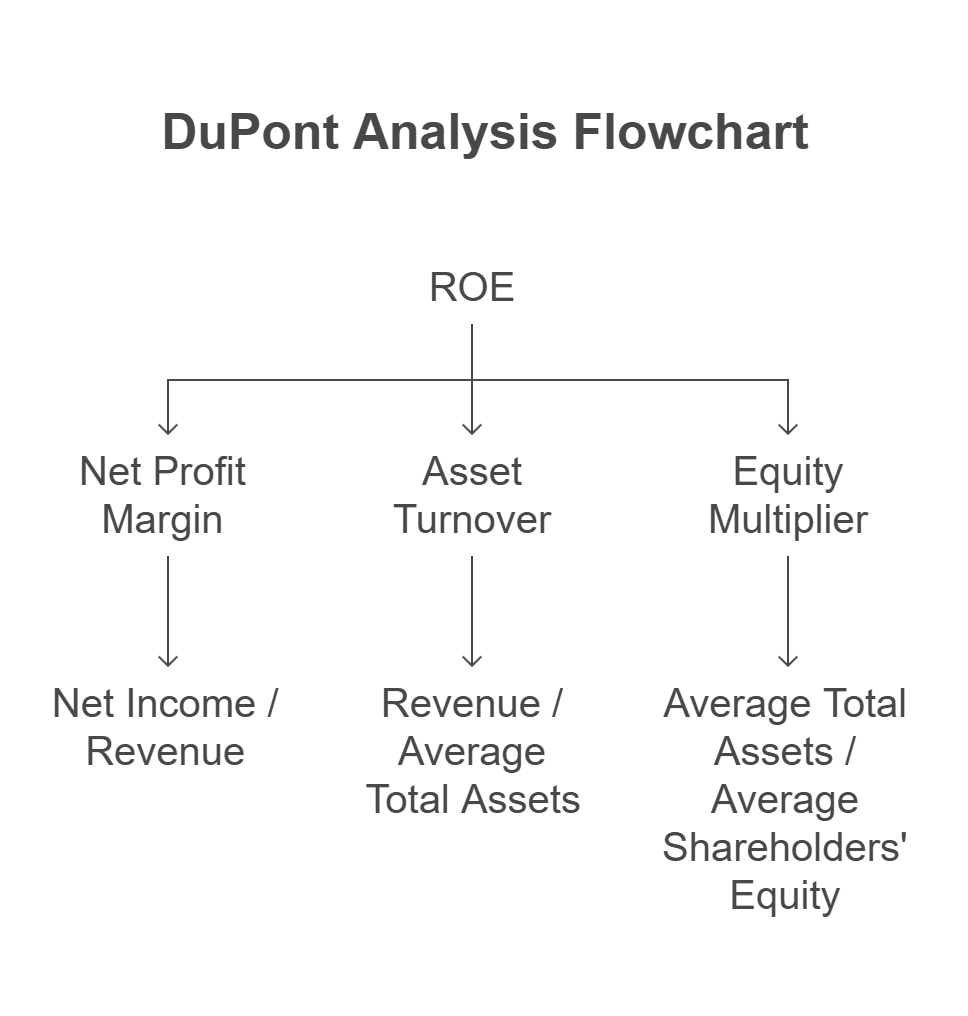
The DuPont analysis breaks ROE into three components:
- Net Profit Margin – How much of your revenue drops to the bottom line.
- Asset Turnover – How efficiently the company uses assets to generate sales.
- Equity Multiplier – A measure of financial leverage.
ROE = (Net Profit Margin) × (Asset Turnover) × (Equity Multiplier)
Each of these tells a different story about how the business is being run. It’s not just about what the ROE is, it’s about why it is.
Let’s break down each component so you can apply this framework with precision.
Net Profit Margin = Net Income / Revenue
This tells you how much profit the company keeps from every dollar of revenue. High margins often signal pricing power, operational efficiency, or both. As a value investor, look for consistency and expansion here. Thin or declining margins could mean competitive pressures or rising input costs.
Asset Turnover = Revenue / Average Total Assets
This metric captures how well the company utilizes its asset base to generate sales. Capital-intensive businesses will naturally have lower asset turnover, but within each industry, it’s a useful measure of efficiency. Improving asset turnover often reflects better inventory management or asset-light business models.
Equity Multiplier = Average Total Assets / Average Shareholders’ Equity
This reflects the degree of financial leverage. A higher equity multiplier means the company is using more debt relative to equity. Leverage magnifies both profits and risks. A rising equity multiplier in a stable business might suggest capital structure optimization. In a volatile one, it could be a red flag.
This decomposition transforms ROE from a static figure into a dynamic insight machine.
Why You Should Care: Finding Moats, Red Flags, and Hidden Gold
This is where DuPont analysis shines for a value investor.
If a company’s high ROE is driven by excessive leverage (equity multiplier), you now know you’re not looking at operational excellence, you’re looking at risk. On the other hand, if high ROE is driven by strong margins and fast asset turnover, you may be looking at a moat.
Here’s the kicker: you can use DuPont trends over time to see exactly how management creates, or destroys, shareholder value.
You don’t need to guess. The numbers are right there.
Case Study Comparison: Which Company Would You Rather Own?
Let’s say Company A and Company B both post a 15% ROE.
- Company A gets there with 5% net margin, 1x asset turnover, and a 3x equity multiplier.
- Company B posts 15% ROE with 15% margin, 1x turnover, and no leverage.
At first glance, the ROE is identical, but the paths taken couldn’t be more different. Here’s how each lever tells a deeper story.
Net Profit Margin: Company B’s 15% margin means it earns $0.15 for every dollar of revenue, compared to just $0.05 for Company A. This reflects far stronger pricing power and operational efficiency. Company B’s high margin also provides more cushion during downturns, making its profitability more durable.
Asset Turnover: Both companies generate $1 in revenue for every $1 in assets, meaning they are equally efficient at utilizing their asset base. Since asset turnover is identical, it puts more weight on understanding where the return differences are really coming from—leverage and margin.
Equity Multiplier: Company A relies on leverage – specifically, $3 in assets for every $1 in equity—to achieve its ROE. This adds fragility. If revenues decline or interest rates rise, Company A’s equity could erode quickly. Company B, on the other hand, earns its returns without leverage. That speaks volumes about its business quality and resilience.
Final Verdict: Company B is the clear winner. It earns superior margins, avoids debt, and still delivers the same ROE as its riskier peer. That combination suggests a competitive moat and a business model that’s built to last. As a long-term investor, this is exactly the type of company you want compounding in your portfolio.
DuPont analysis doesn’t just clarify performance – it reveals the mechanics of return generation. And when you understand those mechanics, you invest with greater clarity and conviction.
How to Use DuPont in Your Process Without Overcomplicating Things
You don’t need to plug numbers into Excel every day. Just look at the trends:
- Is ROE improving because margins are expanding? Or because the company is piling on debt?
- Has asset turnover improved over time? If so, how are they doing it?
- What happens to these metrics during down cycles?
Incorporate DuPont as a standard part of your due diligence—not a once-in-a-blue-moon check.
The DuPont Edge in Small Cap Value Investing
In the small cap value universe, this tool is even more valuable. These companies often operate under the radar, with thinner analyst coverage. A rising ROE could tempt others in – but when you run the DuPont analysis, you might spot a balance sheet bloating with debt or margins quietly compressing.
If you’re building a long-term compounder portfolio, you can’t afford to skip this step. DuPont helps you avoid value traps—and spot the hidden champions.
Conclusion: ROE Is the Destination, DuPont Shows You the Map
The DuPont Analysis doesn’t just explain ROE – it explains how companies generate returns. If you’re serious about constructing a high-performance portfolio with margin of safety baked in, this is a tool that belongs in your kit.
Next time you see a company with an attractive ROE, ask yourself: how did they get there? DuPont will tell you.
And if you’re looking to sharpen your portfolio construction skills even further, our premium members get full access to portfolio breakdowns, screening tools, and allocation strategies where DuPont plays a key role.


